

Pay-per-click is a simple and enticing advertising model. You pay a fee each time an ad gets clicked on. Not only is that super easy to wrap your head around, but it seems fair that you only put the money down after the ad does what it’s supposed to.
The problem with simple and enticing things that everyone wants a piece. That means you’ll face a lot of competition in the PPC arena. With competition comes the need to be strategic.
Which brings us to our topic du jour: PPC reporting.
An effective PPC strategist doesn’t guess. They collect, interpret and act on real data represented in PPC reports.
Whether you’re trying to create a report to show other company stakeholders, or need help with client reporting, you’ve come to the right place.
First, let’s set the record straight on PPC
Obviously PPC stands for pay-per-click and obviously that means you pay a fee each time someone clicks on your ad. The thing a lot of people get wrong is conflating paid search and PPC.
Paid search is a type of PPC. Social media advertising is also a type of PPC. So is display advertising. Any digital advertising where the advertiser pays the publisher (the platform that actually lists the ad) per click counts as PPC advertising.
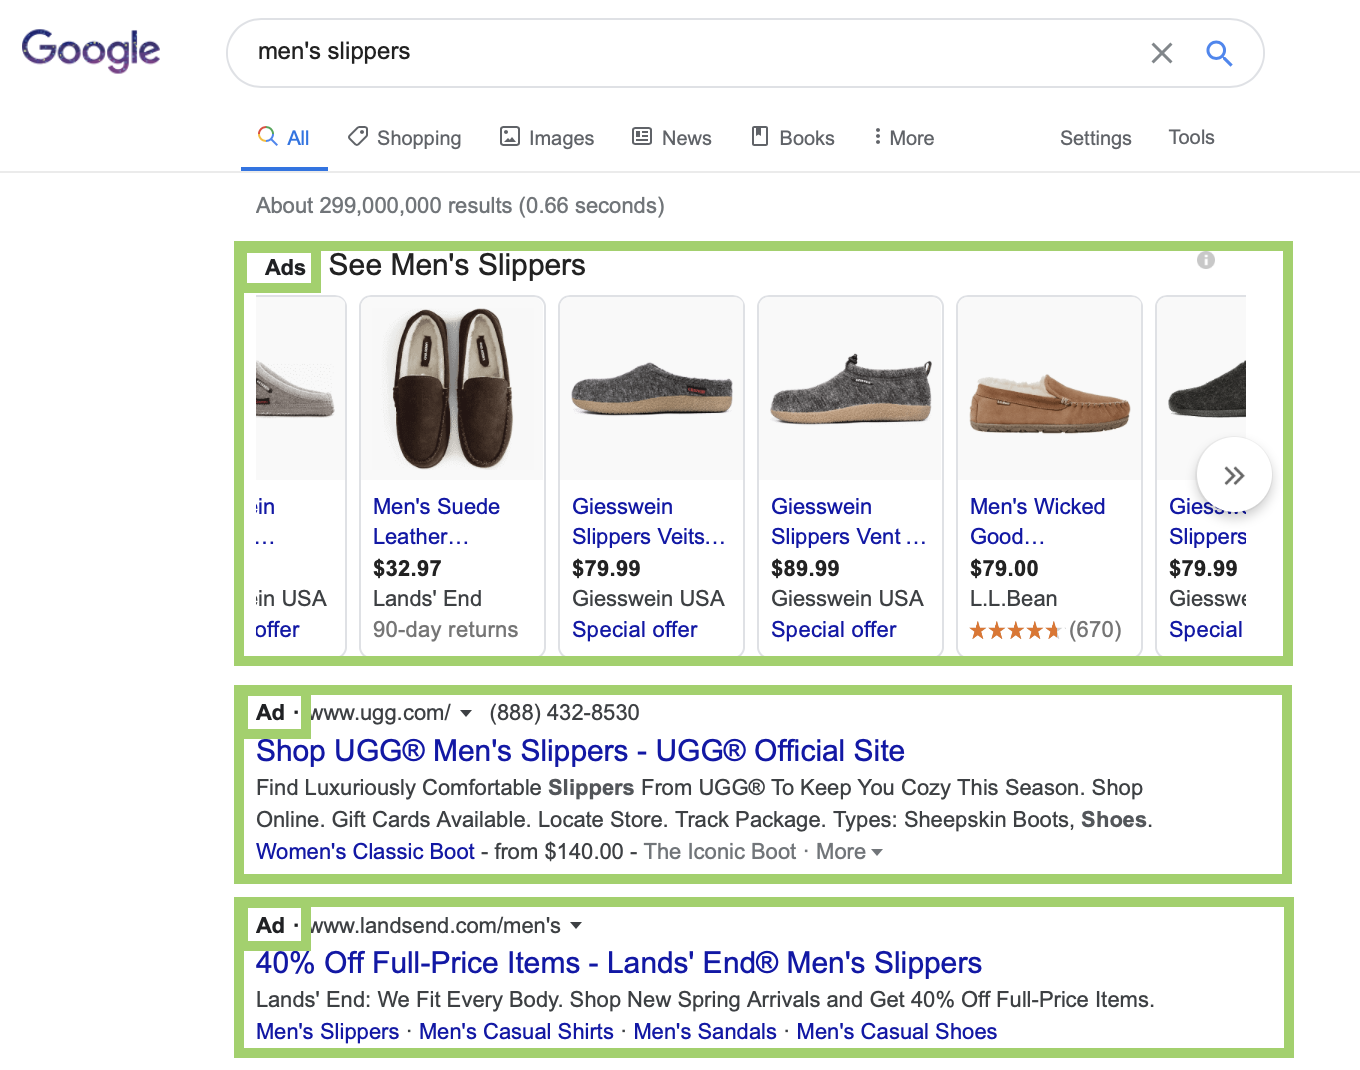
Below is an example of search PPC advertising:
This is display PPC advertising:

PPC reporting: Information and data aren’t the same thing
Now for the fun stuff.
Data is mostly meaningless without the right context. Saying you’ve earned 150 clicks in 1 month from a paid search ad, for instance, means nothing. Is 150 a lot? Is it a little? What happened after those people clicked?
Information is data with meaning, and a great PPC strategist always looks for the story that the data is trying to tell.
If there’s only one thing you take away from this entire post, let it be that.
And with that in mind, let’s walk through the key metrics you should pay attention to as you attempt to tell a story through your PPC reporting.
Advertising channels
Your PPC channels are the setting for your data story, so to speak. They will influence the specific metrics you pay attention to in your PPC report and can inform your benchmarks.
For example, fewer than 0.5% percent of people click on a display ad, while the average CTR for a paid search ad on Google Ads is 3%-5%. Facebook CTR is less than 1%.
You don’t necessarily have to create a separate report for every one of your PPC campaigns, but it’s important to have a broad idea of what to expect from each channel.
Having said that, let’s look at some of the most popular PPC marketing channels:
Social media
Sponsored posts, ads and boosted posts are examples of PPC ads that might be served on various social channels, such as:
- Twitter.
- LinkedIn.
- Pinterest.
- YouTube.
(Notice Facebook is missing? As far as we can tell from their site, Facebook doesn’t have a PPC model, but rather, charges advertisers every time an ad is served, regardless of whether the user clicks. Facebook still uses CPC as a metric, but their pricing model is not actually PPC.)
Display networks
There are many display ad networks and many different types of ads you can display through them. Some of the most popular display ad networks include:
- Google Display Network.
- Yahoo! Network.
- Apple Search Ads (on the Apple App Store).
- Taboola.
- Facebook Audience Network.
Search
Paid search boasts some of the highest click-through rates, and it isn’t hard to see why. Ads are targeted based on keywords, so they’re almost always relevant to what a user is searching for. But with that high CTR comes more pressure to get the PPC campaign just right. Every click will cost you, so it’s crucial that you’re targeting the right keywords.
- Google Ads (formerly AdWords)
- Microsoft Advertising (formerly Bing Ads).
PPC data-collection and reporting tools
For actual PPC data retrieval, start by going straight to the source. For example, if you’re publishing your ads through Google Ads, then Google Ads will be your best source of performance data. If you’re publishing your ads on Facebook, then use Facebook’s ad data. And so on and so forth.
You can also pull in outside data sources to supplement your campaign performance data. These include:
- Keyword research data: This is particularly important for paid search. The keywords you choose to target will have a direct impact on your Google Ads campaigns. A keyword research tool like SEMrush will show you much more data than Google’s free Keyword Planner and can help you understand, explain or plan a response to performance fluctuations.
- Social listening data: SproutSocial, HubSpot, Buffer, Hootsuite – all of these tools provide data about your brand and how people are referring to it across social channels. This information can help justify, inform or guide your decisions for certain PPC campaigns on social media.
- Google Analytics: Google Analytics can tell you a lot about peoples’ behavior after clicking on an ad – for instance, if they subsequently poked around your website, and which pages they were most interested in.
- AdRoll: The beauty of a tool like AdRoll is that it can act like a hub to launch, monitor, edit and report on PPC campaigns across multiple platforms (social, search, email, display, native, etc.). It can even integrate directly with data sources including Google Analytics and Google Ads, as well as Facebook, Twitter, YouTube and others.
- Reporting Ninja: Unlike AdRoll, Reporting Ninja isn’t a PPC manager – it’s exclusively for reporting. It doesn’t integrate with nearly as many display ad networks as AdRoll, but it’s a solid way to generate an automated PPC report.
When it comes to compiling your raw data into a polished report that executives will get value from, there are plenty of free alternatives to the likes of Reporting Ninja that are more compelling to look at than a Google Sheet. These include:
- Data Studio from Google.
- Tableau.
- Klipfolio.
- Microsoft Power BI Desktop.
Key metrics
Finally, we arrive at metrics. Any PPC manager worth their salt uses them to help tell a story about campaign performance.
Most metrics are relative, meaning they tell you little without comparison to some other benchmark. There’s plenty of data out there about average CTR, impressions, etc. by industry. While important for setting a scene, that data is not nearly as valuable as your own historical data.
In marketing, progress is more important than success. Are you improving, are you staying the same or are you doing worse? The goalposts are always moving. As you chase them, make sure you closely track the following metrics:
- Overall spend: Your total ad spend in a given time period.
- Average cost-per-click: Average CPC of an ad campaign or ad group.
- Impressions: The number of times users see an ad.
- Reach: The number of users who see an ad (one user can see the same ad twice).
- Clicks: The number of clicks on an ad.
- Click-through rate (CTR): Percent of impressions that lead to clicks.
- Conversion rate: Percent of clicks that lead to a conversion.
- Cost per conversion: How much money you have to spend on average to generate a conversion. To calculate, multiply your clicks by your CPC and then divide by your number of conversions. (50 clicks x $1 / 10 conversions = $5 per conversion.)
- Cost per mille (CPM): The cost per every 1,000 impressions. Twitter, Instagram, LinkedIn and many display ad networks give advertisers the option to pay this way as opposed to paying for clicks.
Don’t forget about ROI
Calculating ROI is refreshingly simple. First figure out how much money you spent on your PPC campaigns. Easy enough – just look at your budget. Then figure out how much revenue you generated as a result of that spend. To calculate this second part, look at how much revenue flowed in as a direct result of the conversions on your PPC ads.
Before you get there, though, you may need to focus on refining your target audience parameters (if you’re on social media or display networks) and experimenting with keyword selection (on search).
This is because it’s important to make sure that you’re actually employing proper PPC practices before coming to a conclusion about whether or not it works to generate conversions and sales. To use an analogy, a first-time driver needs to learn to correctly use a vehicle before they make a definitive decision about whether cars are good at getting them places.
As you refine your PPC acumen, focus on experimenting with different tactics (your title tags, meta descriptions, ad copy, keyword selection, etc.). In tandem, optimize your landing page for conversions. If at any point you see your CTR improve, keep a hawk’s eye on conversions and how much revenue those conversions are generating. Simply put, you don’t want to get too jazzed about clicks if they’re not leading to conversion. You are paying for those clicks, after all.
Putting it all together
Here’s the tricky thing about PPC campaigns: Even if you meticulously tracked all the aforementioned metrics and calculated ROI, you still wouldn’t be capturing the full picture of PPC effectiveness in your report.
Why?
Because the landing page at the other end of every ad is a direct variable in campaign performance.
Even if you’ve put together an otherwise masterful PPC campaign, your report might look grim. That may have nothing to do with PPC management and everything to do with the quality of your website content.
The only way to know for sure would be to turn over more stones. Maybe your landing page isn’t optimized for the keyword you’re targeting, which could be hurting the Quality Score of your paid search ad. You can figure this out in Search Console by figuring out what keywords that page is ranking for, or in Market Muse, by seeing what topics you can cover to improve your chances of ranking for your chosen keyword.
Consider another scenario: Your ad is in fact leading to revenue, but not in the way you expected. Let’s say users are moving to different pages on your site through your ad. You could figure this out in Google Analytics by seeing if users are visiting other pages after landing on the ad page.
The point is, there is no one-size-fits-all template for PPC reporting. Rather, you start with the KPIs, and then drill down and explore to try to get to the root of what they’re telling you. There are many possible narratives to a PPC campaign. This is true of all digital marketing.
So yes, PPC is refreshingly simple in theory. But only through thorough reporting can you be certain that the clicks you pay for are in fact worth their price tag.