

We live in a world that is data-rich and information-poor.
I’m talking to you, Mr. or Ms. Executive. I’m telling you that your pretty dashboard is good for one thing: Looking pretty.
But it’s not your fault. The problem is there are so many reports and metrics you can access across dozens of software solutions, each with their own unique terminologies. How do you distinguish between insightful information and data for the sake of data?

Metrics dashboards will tell you things about keyword rankings, organic traffic, pageviews, bounce rates, time on site, and they’ll sometimes even rank your site with their proprietary algorithm.

As a CMO/VP/CEO, you need to worry about two metrics: CPA and CPL.
Calculating CPA
CPA stands for cost per acquisition. It’s a simple equation that compares the dollar investment made in a program compared to the number of deals closed as a result of that investment.
Example:
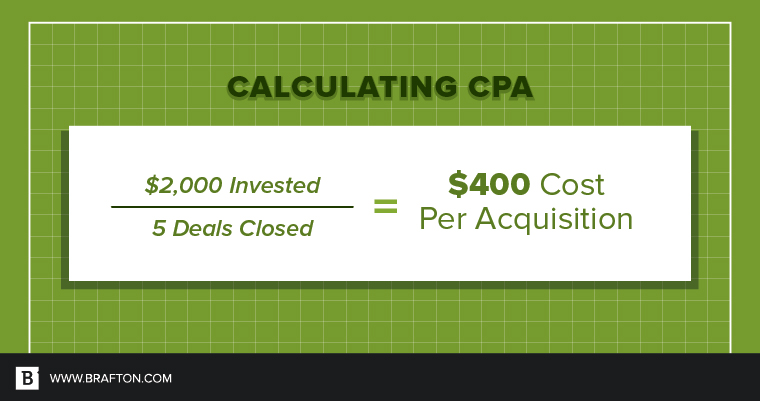
In layman’s terms, if you invest $2,000 in an initiative that yields five closed deals, it cost you $400 per acquisition.
Is this good or bad?
It depends on the size of your average closed deals. If your average deal size is $2,000, then your CPA is 20% of the revenue it generated, or a 500% ROI (not taking into account your cost of goods sold). If your cost per acquisition were $2,000, you would be breaking even. So the answer is, it depends on your business model, and I’ll leave that to you to figure out.
When you don’t have enough information, calculate CPL.
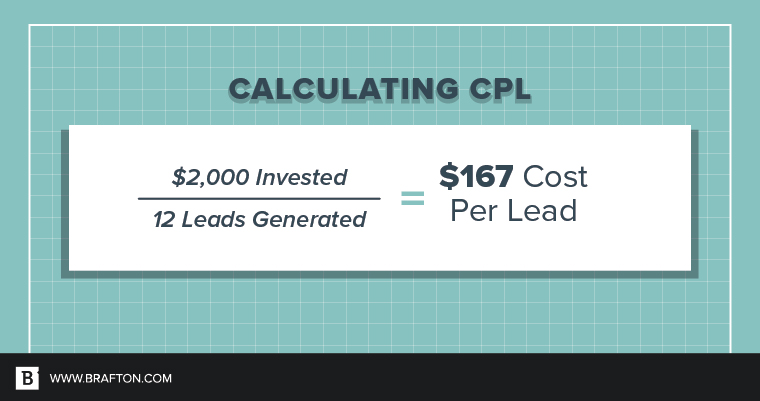
CPL stands for cost per lead. Similar to CPA, CPL is calculated by comparing the dollar amount invested in an initiative versus the amount of leads it generated. This is not taking closed deals into account, only leads.
Example:
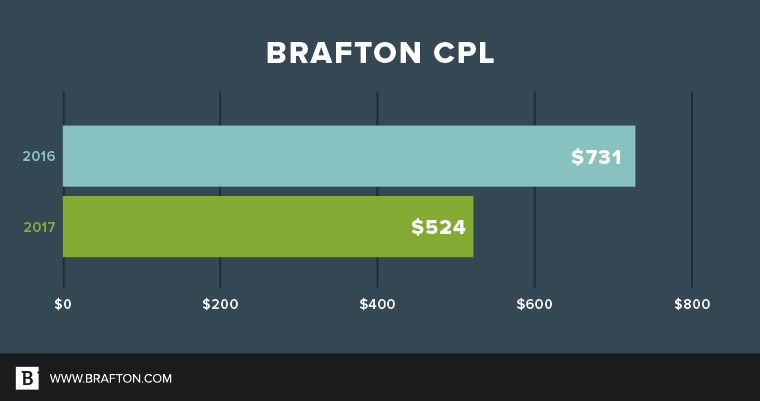
CPL applied to a real Brafton client:
We will use a client in the industrial equipment manufacturing industry as an example for how to measure CPL.
The way this company generates commercial value through its website is via requests for service quotes. This single metric (CPL) is used to gain an understanding of how the site is performing.
No organic traffic numbers, no bounce rate, no gimmicks. Money in and money out.
Over the first six months of 2016, Brafton’s CPL for this client was $731. For every $731 dollars spent with Brafton, we generated one lead. In the first half of 2017, that number dropped to $524 per lead, as a result of a 39.6 percent increase in requests for quotes.
Why would you use CPL over CPA?
Sometimes it’s impossible to draw a straight line from a specific initiative to a closed deal. Attribution is an issue all digital marketers battle. However, if you know the average close rate for leads you can reverse-engineer your CPA by discounting down for the likely number of deals that closed from your leads.
We will use our client example to calculate a CPA.
We know that our client paid $39,300 to Brafton over six months for 75 leads with an average close rate of 27 percent, at an average size of $11,000 per deal. With some quick arithmetic, we can calculate the following:

Comparing our CPA of $1,941 to our average deal size of $11,000, we can estimate a 567 percent return on investment (not including COGS).
Conclusion
Did you notice how we didn’t mention “organic traffic,” “keyword rankings” or “bounce rates” once? When evaluating performance metrics and behavior, web analytics metrics are irreplaceable. When discussing ROI, they can often often be misconstrued as a return on your investment.
Don’t have the wool pulled over your eyes – always keep your mind on the money.


