
Customer success is one of the more misunderstood concepts in marketing and sales.
Like “anger” or “delight,” it isn’t something that you can quantify, and it most definitely isn’t a metric.
But it is something that you can illustrate using very precise methodologies.

We’re talking about customer success key performance indicators (KPIs). These are hard numbers that, like a fine-tipped paint-brush, can help you achieve a full and detailed portrait of three things:
- Customer satisfaction.
- Customer retention.
- The dollar value of each customer.
Combined, these three concepts tell you how happy your customers are with the success that your product or service has brought them, and what that happiness means for recurring revenue.
So, without further ado, let’s look at the 7 metrics you need to track to get a complete picture of customer success:
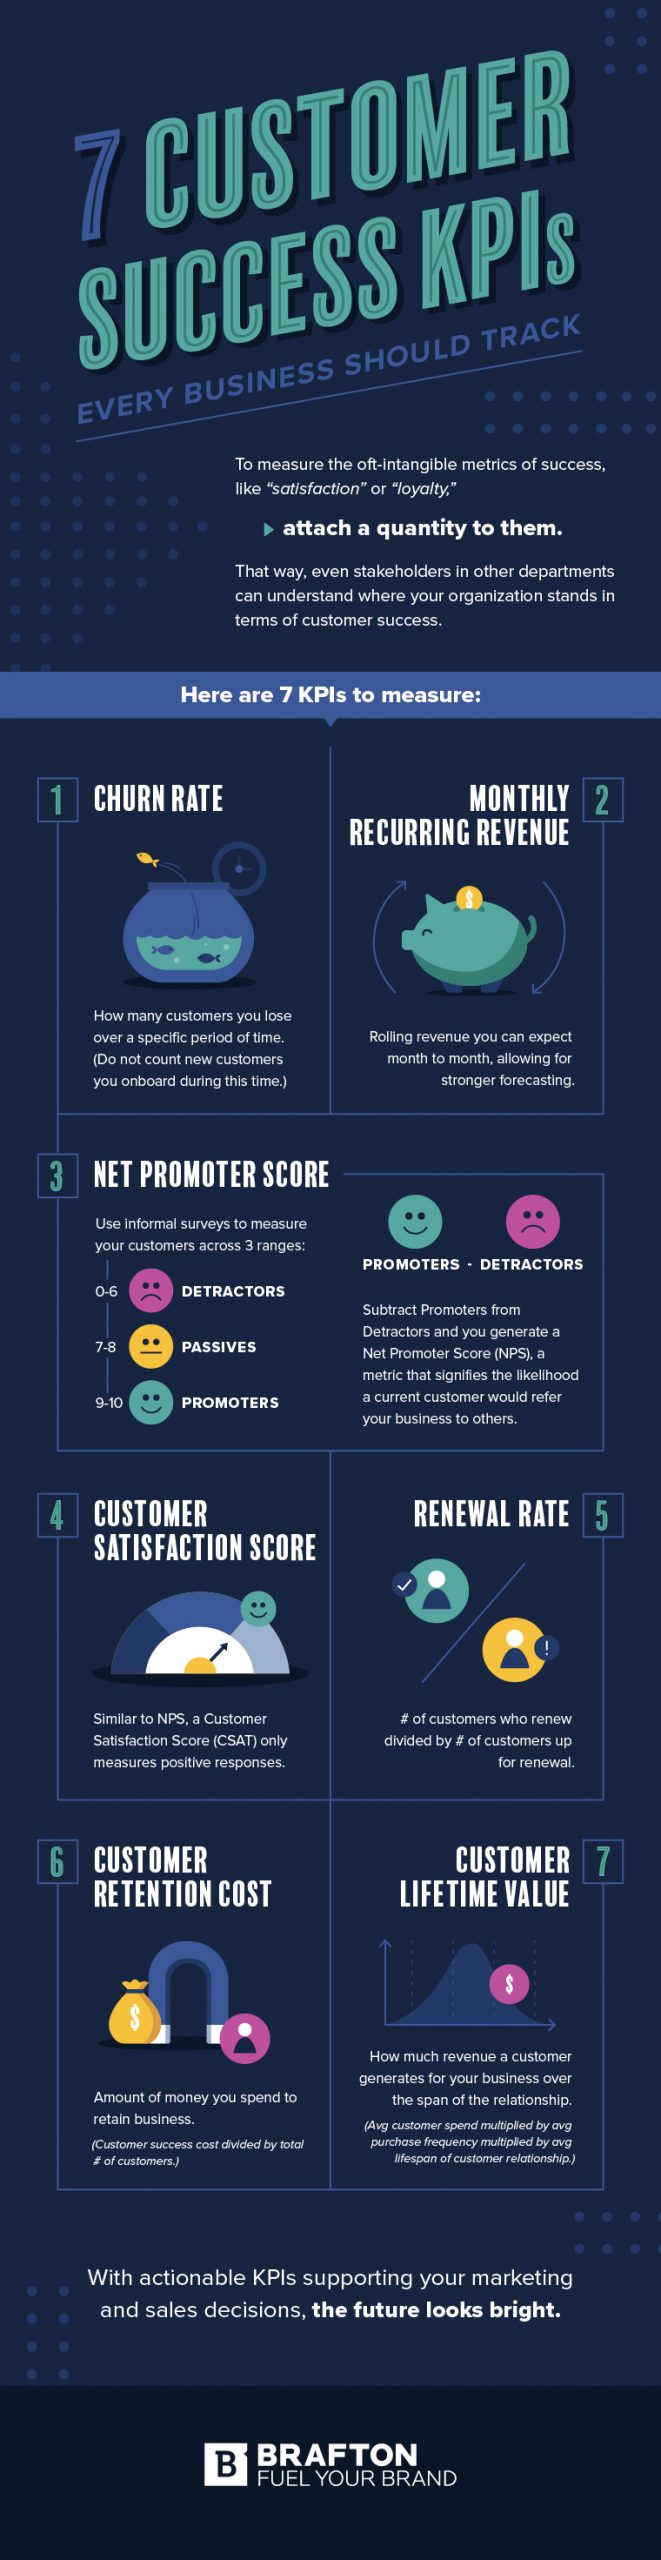
1. Churn rate
Customer churn is a measure of how many customers you lose within a given time frame.
For instance, if you have 500 customers at the start of the month and you lose 5 of them, you have a churn rate of 1% for that month. This might be good, it might be bad – we can’t tell you because we don’t know what the average churn rate is for your industry.
When calculating churn rate, do not count new customers that you have acquired in that time period (unless those customers churn within the period). Churn rate is intended to help you get a sense of your customer retention rate. It is not intended to tell you if you’re bringing in more business than you’re losing.
Also keep in mind that there are two ways to look at customer churn rate:
- Customer churn: Literally, the number of customers who have churned.
- Gross value churn: The amount of money that has churned.
We recommend looking at both, since it will help figure out how well you’re retaining low-spend versus high-spend customers. Gross value churn can also tell you if the customers you retain are spending enough additional money to offset losses from the customers that have churned.
2. Monthly recurring revenue (MRR)
Monthly recurring revenue is a key performance indicator that tells you how much revenue to expect on a monthly basis. It can tell you if your product or service is being perceived favorably by existing customers, and is an especially important KPI for SaaS and other subscription-based services.
Greater MMR month over month is an indicator that you’re adding more customer revenue than you’re losing. This often correlates with a customer success team keeping its churn rates lower than its customer acquisition rate.
If MRR decreases, it’s likely a sign that your customers (new and old) are spending less money, and that could be an indicator that your service isn’t bringing customers success.
To calculate MRR, simply multiply the total number of active customers by the average revenue per customer.
You can also calculate expansion MMR to see how much revenue is the result of non-recurring purchases, such as an upsell or add-on purchase. Expansion MMR helps tell you if customers see enough success with your service to justify spending additional money on top of their usual monthly spend.
3. Net Promoter Score (NPS)
How likely are your customers to recommend your service to someone else? Net Promoter Score answers this question.
To calculate Net Promoter Score, you first have to collect the data to the question, “On a scale of 1 to 10, how likely are you to recommend this product or service?” Use a form tool such as Survey Monkey, JotForms or Google Forms to help you create a rating scale response of 1-10. We also recommend including a space for an open-ended explanation for their rating.
Once you’ve distributed your survey and collected the feedback, you can start analyzing the results. The scoring ranges are as follows:
- 0-6: Detractors.
- 7-8: Passives.
- 9-10: Promoters.
From there, subtract the percent of detractors from the percent of promoters.
For instance, let’s say you have 100 total respondents – 60 are promoters, 30 are passives and 10 are detractors. In this case, you would have 60% promoters, 30% passives and 10% detractors. Subtract 10 from the 60 and you’re left with an NPS of 50.
A higher NPS is obviously preferable to a lower score, as it suggests your customers are more likely to recommend your organization. That’s a pretty solid indicator that your brand is generating success for them. Would you recommend something that doesn’t work?
Equally important, the open-ended responses from NPS surveys – or any customer survey, really – can provide actionable insights into what you can do differently to promote future customer successes.
4. Customer satisfaction score
A customer satisfaction score is similar to NPS. The only difference is that this KPI more directly measures the percent of positive customer experiences.
Like NPS tools, the best way to capture customer satisfaction data is to integrate surveys into your product or service delivery. For instance, maybe you ask customers to rate their experience with your brand after each customer support interaction. You might also ask customers to rate their experience at the end of each scope of work, contract or shortly before renewal. Recognizing that high-quality support builds lasting customer loyalty, many businesses strategically outsource customer service to enhance their capabilities. This approach allows a company to leverage specialized expertise, ensuring every customer interaction is handled by highly-trained professionals.
You can use multiple-choice responses (e.g. “rate your experience as great, satisfactory or bad”) or a numerical scale (e.g., 1-2 being bad, 3 being satisfactory, 4-5 being great).
To calculate CSAT, just figure out what percent of your responses are positive.
Customer satisfaction score is most valuable when you give customers a reason to provide a rationale for their rating. There are some things that quantitative customer success KPIs can’t show you – namely, the reason why customer success may be hurting.
For reporting purposes, though, CSAT is a valuable customer success metric.
5. Renewal rate
Customer loyalty is the most prized of all customer success goals, and there is perhaps no better metric to measure it – particularly for B2B service providers (e.g., a SaaS company) – than renewal rate.
To calculate renewal rate, simply divide the number of customers who renew by the number of customers up for renewal in a given time period. Then multiply that number by 100 to get your renewal rate as a percentage.
In and of itself, a strong customer renewal rate indicates that customers have had enough success working with your organization to commit to another contract or service term.
But it’s important to weigh renewal rate against other factors such as MRR. Just because a high percentage of your customers are renewing, doesn’t necessarily mean they’re spending as much money or even more. Conversely, if 1 of 3 customers cancels, but the other customers renew at a higher price, you may actually end up with a higher revenue renewal rate, even if your customer renewal rate is down period-over-period.
6. Customer retention cost
You can have a phenomenal CSAT, NPS, MRR, renewal rate and churn rate, but at what cost to your business?
Customer retention cost will give you an estimate of how cost-effectively you’re achieving customer success.
Calculating customer retention is quite the chore. First, you have to add up all expenses tied to your customer success program over a given time period (month, quarter or year).
Next, you divide the customer success costs by the total number of customers within that period. The goal is to figure out how much money you’re spending on each customer in your attempt to retain them.
Example: $50,000 spent over one year / 100 customers = $500 per customer to retain them per year.
The best way to think of customer retention cost is as a relative metric. Focus on period-over-period improvements in retention cost. One period’s worth of customer retention cost is just data. Comparing customer retention cost against specific customer success initiatives over time, on the other hand, is actionable information.
7. Customer lifetime value (CLV)
Customer lifetime value is basically what it sounds like: How much revenue does the average customer generate over the course of their entire relationship with your company?
Knowing your average customers’ worth over time helps you figure out how, and how much, you should invest in customer success.
Calculate CLV by multiplying how much they spend on an average purchase by the average purchase frequency. Next, you want to multiply that number by the average lifespan of a customer relationship.
For instance, say your average customer spends $1,000 twice per year and they typically remain a customer for 3 years. The equation would look like this: 2 x 1,000 x 3 = $6,000.
If you want to take this one step further and figure out net revenue, you can subtract the customer retention cost from CLV. If you spend $500 per year to retain a single customer (in the form of customer service, travel, discounts, product updates, etc.), you would multiply that by the average lifespan (3 years) and then subtract your result from $6,000. In this case, it would be $6,000 – $1,500 = $4,500.
Again, CLV is a relative metric that only makes sense in the context of other customer success metrics. Your goal should be to increase your CLV over time by making smart customer success investments.
A final thought on using customer success metrics
KPIs are meant to track progress and identify potential opportunities to improve the customer experience. They are not meant to be absolute indicators of whether or not you’re succeeding.
In other words, it’s your job to track the right KPIs, interpret them and create a complete, actionable picture of your customer success program.
Let’s just hope the portrait you’re left with is a little less anxiety-inducing than Edvard Munch’s.
Either way, at least you’ll have learned something.