

We’ve all been there – it’s 4:30 p.m. on a Friday and the boss wants to know which content brought in the most leads for the sales team during the quarter. You freeze, then start spouting off data about pageviews and time on page as you watch a combination of confusion and impatience spread across your boss’s face. Wouldn’t it be great if there were a way to easily see which content actually results in leads?
Enter: Google Analytics goals.
Used effectively, Google Analytics goals will tell you exactly which content inspired users to fill our forms (read: which content turns visitors into leads) and how much value that represents to your brand. So let’s talk about using Google Analytics conversion tracking to become a digital marketing rock star and take back your Friday night.

Setting up Google Analytics goals
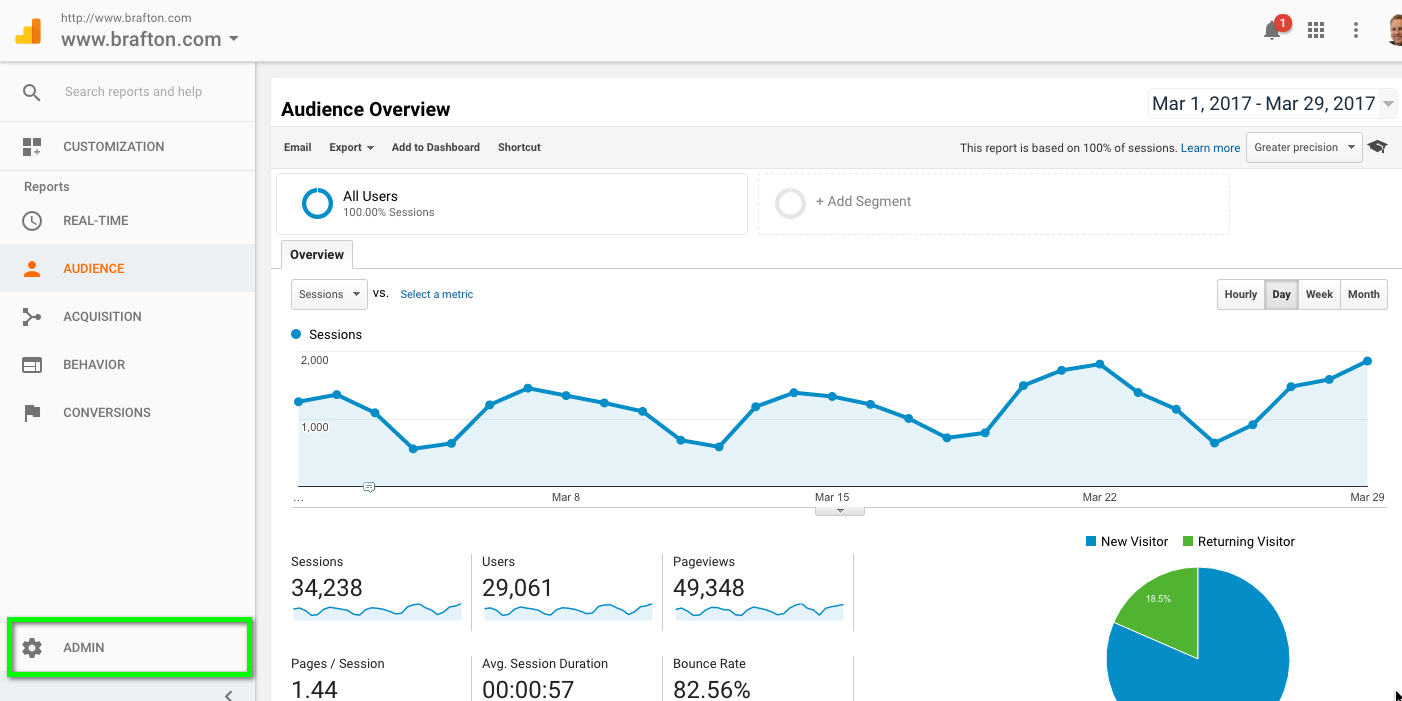
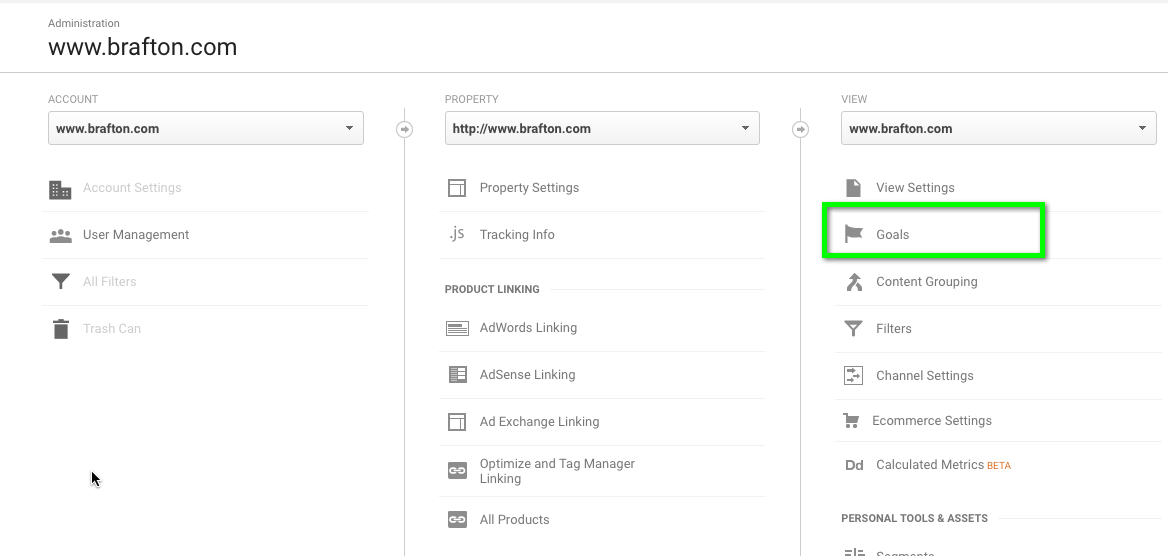
You can create Google Analytics goals in the Admin panel, under the specific view you want to track conversions for. The Admin panel can be a bit elusive, so let me show you how to get there:
Goals start tracking data from the date they’re created (not retroactively), so make sure you prioritize setting them up as early on as possible.
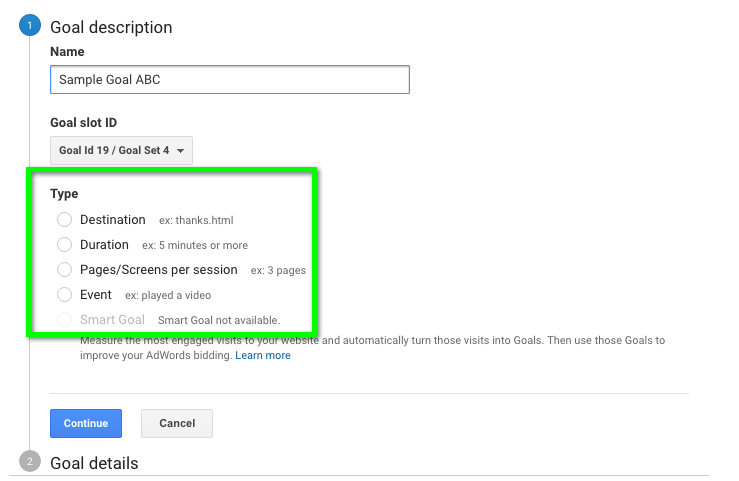
Let’s take a step back and define the five types of goals available:
- Destination: Reaching the page/type of page that represents a conversion.
Pro Tip: The destination URL should always be the page a user reaches after completing the desired action (e.g. /thank-you). Just make sure this URL is only accessible via a gated pathway and is not indexed by search engines. Otherwise people could find this page through search and artificially inflate your numbers. - Duration: Spending a specified amount of time on the site.
- Pages/Screens per session: Viewing a specified number of pages during a visit.
- Event: Performing a specific action on the site that is tracked through an event (more on this later).
- Smart Goals: Measuring the most engaged visits to a website that are most likely to result in a conversion. (Side note: You can use this to improve AdWords bidding.)
In general, you’ll want to focus on Destination and Event goals. Tracking goals for how long a user spends on your site or how many pages they view isn’t a great measure of whether they will contribute to your company’s bottom line (unless you make your money selling ads on your site). More often it skews the otherwise valuable data on which parts of your site are lead gen gold.
Google Analytics Events
Not all conversion actions on a website can result in a nice neat Thank You page. When you’re looking to see whether a user takes a desired action on your website without inserting a page that could detract from the experience, look no further than Google Analytics Events.
Event Tracking in Google Analytics used to be a somewhat complicated endeavor, involving HTML and developer resources. But now, marketers have Google Tag Manager, which has put these analytics back into their hands. With a one-time addition of the Tag Manager container to your site’s code, you’ll have a wealth of complex tracking options at your fingertips in a marketer-friendly UI.
Google Tag Manager uses tags and triggers to define what you’re looking to track. The tag represents the site activity and the trigger determines under what conditions to log that activity.
Tags: Defining the event
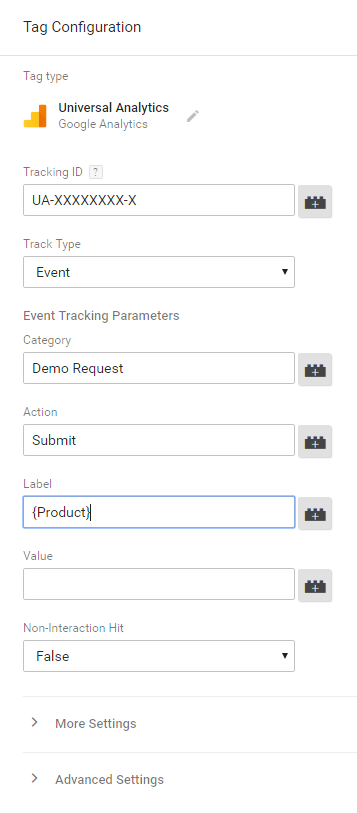 With an event, you need to assign a category, action and label. While there’s technically no wrong way to do this, experience shows that the Category is best for defining the type of activity (e.g. Demo Request), the Action explains what happened (e.g. Submit), and the Label works to specify the event (e.g. {Type of product for which the demo was requested}).
There’s an option to assign a value (we’ll go into the math a little later on), but this can also be done at the goal level if you prefer. You can also make a choice about how an event impacts your bounce rate.
The drop-down for “Non-Interaction Hit” determines whether or not a user who only visits one page on your site but completes the event is counted as a bounce.
This will be set to “False” by default, which means anyone who completes the event won’t be considered a bounce even if they leave the site from there (I typically recommend this since the event we’re tracking should be important enough that a user doesn’t need to go any further to have a valuable interaction with our site).
If you’re looking for a stricter view of bounce rate, you’ll want to change this value to “True” so users who leave the page after completing the event are still considered a bounce.
Triggers: When is an event an event?
Now that you’ve defined your event as a Tag, you need to tell Tag Manager when (or where) to look for that event to occur. This is where Triggers come in.
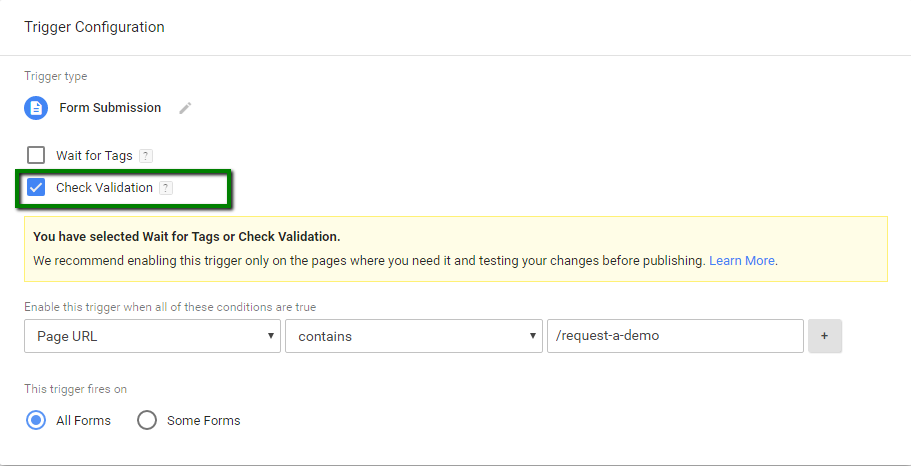
There are many types of triggers, but when it comes to events for goal tracking, the Form Submission trigger is the most useful. This is tailored to lead gen forms and even provides the ability to only count users who successfully submit the form. For this, you’ll want to make sure you check the box for the “Check Validation” option. From there, the user-friendly condition fields let you set which pages the event should be counted on with the same options that are available in Advanced Segments.
Goal funnels: Do users stick to the plan?
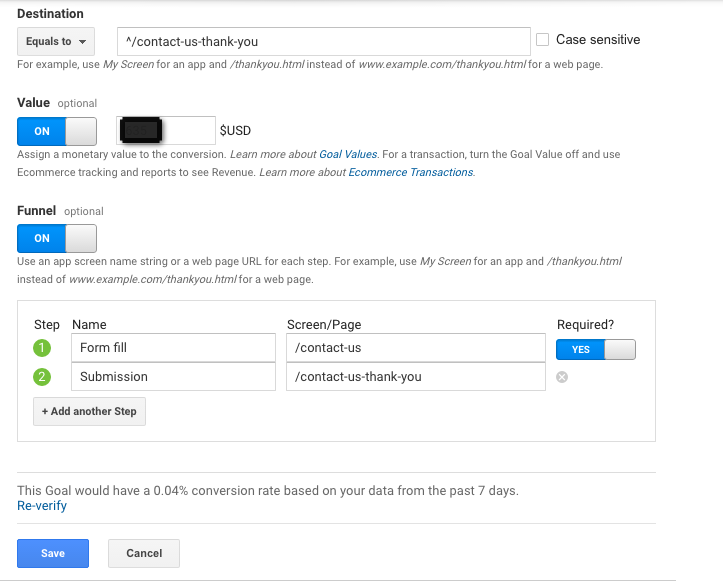
Now that you have visibility into conversions happening on your site, put some things in place to see how users are reaching those goals. Are users taking the expected pathways to conversion? Are there pages along that path that are acting more like a sieve than a funnel? These questions and more can be answered by activating the Funnel option in Goal Details and defining the pages you would expect to be a part of a user’s journey to converting.
The funnel option allows you to tell Google Analytics which pages you think a user would go through to get to a conversion. For example, maybe you feel that users will read a blog post, which leads them into a page about one of your solutions where they find a link to a case study and ultimately decide to click on your Request a Demo CTA from there.
Now that example is pretty broad, but most times you’ll have a number of different pages that are all the same type (e.g. blog posts) that all should count as a step in the funnel. Luckily, that’s totally doable when you use Regular Expressions to define the funnel stages.
Pro Tip: The match type for the funnel steps is dictated by the match type of the goal for Destination Goals, so just make sure to use RegExp if you want this flexibility for defining the funnel steps.
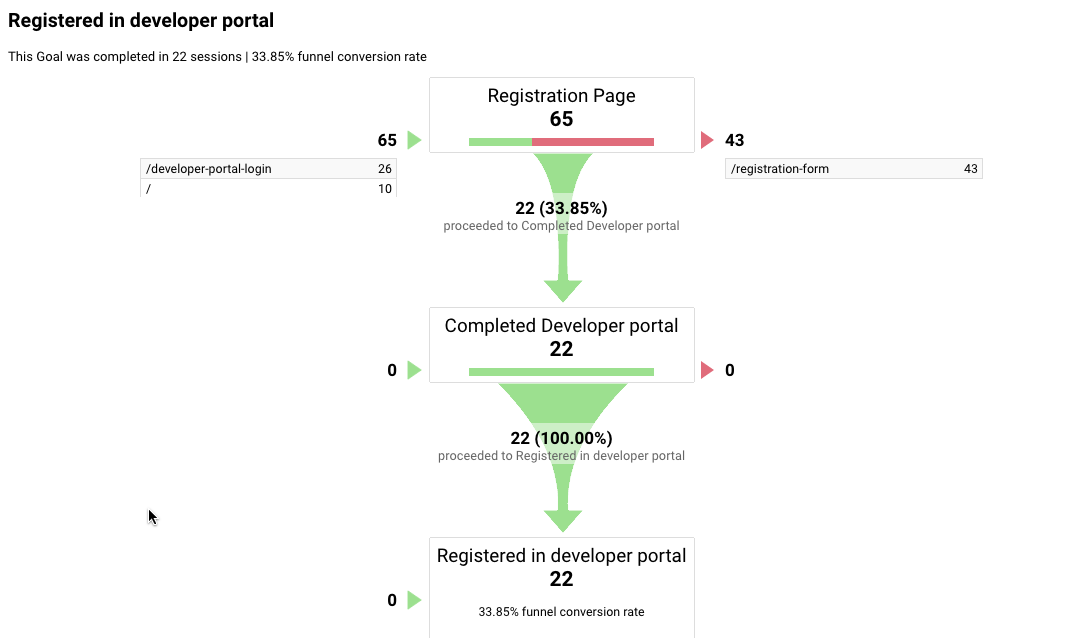
Once you have this set up, you’ll be able to access a great visualization of the path to conversion. Maybe users are dropping off after your product page because the CTA for conversion isn’t clear. Or potentially your visitors circle back to your product page after reaching the form fill because they haven’t been fully sold on the value of a demo.
These issues will all be crystal clear after you examine the funnel views, as this helps you pinpoint where to spend your time and effort to optimize conversions.
Calculating goal value: Turning leads into revenue
Okay, so you’ve set up your goals and defined the pathways you expect users to take to reach them so you know what’s working and what’s not. Now it’s time to sit back and let the kudos roll in, right? Wrong!
While marketers spend their days in a world of MQLs, SQLs and brand awareness, executives lose sleep over things like revenue, profitability and market share. To be a part of that conversation and truly make an impact, marketers need to speak the language of the C-suite and position leads in terms of dollars.
If you’re an ecommerce brand, this work is already done for you through Ecommerce Tracking. But what about non-ecommerce sites, or “soft” conversions like product catalog downloads for a retail brand? Here’s where goal value comes to save the day.
There are a number of ways to determine goal value, all with varying degrees of complexity. Before you start having calculus flashbacks, let’s simplify the math with an example.
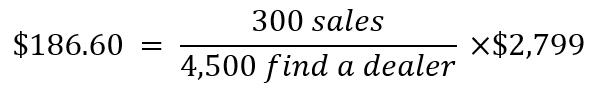
Let’s say you’re the digital marketing manager for Gibson USA, and you want to assign a value to all the “Buy Now” requests that prompt a user to locate a nearby dealer for the Gibson Les Paul Standard 2017 T. The guitar retails for $2,799, and out of 4,500 users who click to find a dealer each month, 300 people actually purchase the guitar. Using the formulas below, we find that each “Buy Now” click is worth an average of $187 to the brand.
Conclusion
It’s déjà vu – the boss walks into your office late Friday afternoon looking for the latest lead info. Only this time you have goals configured for all your lead gen pages on your site with clear funnels defined and dollar values assigned. Before he even finishes his question, you’ve got the numbers up on the big screen and can show him you’ve brought in tens of thousands of dollars in viable opportunities this month. Another weekend saved and another promotion earned, all thanks to strong web analytics. Now go on and enjoy your Saturday. You earned it!